DORA MetricsGoogle Test PyramidState of DevOpsDeep Prototype
CIQuality — CI Pipeline Quality + Flake Audit
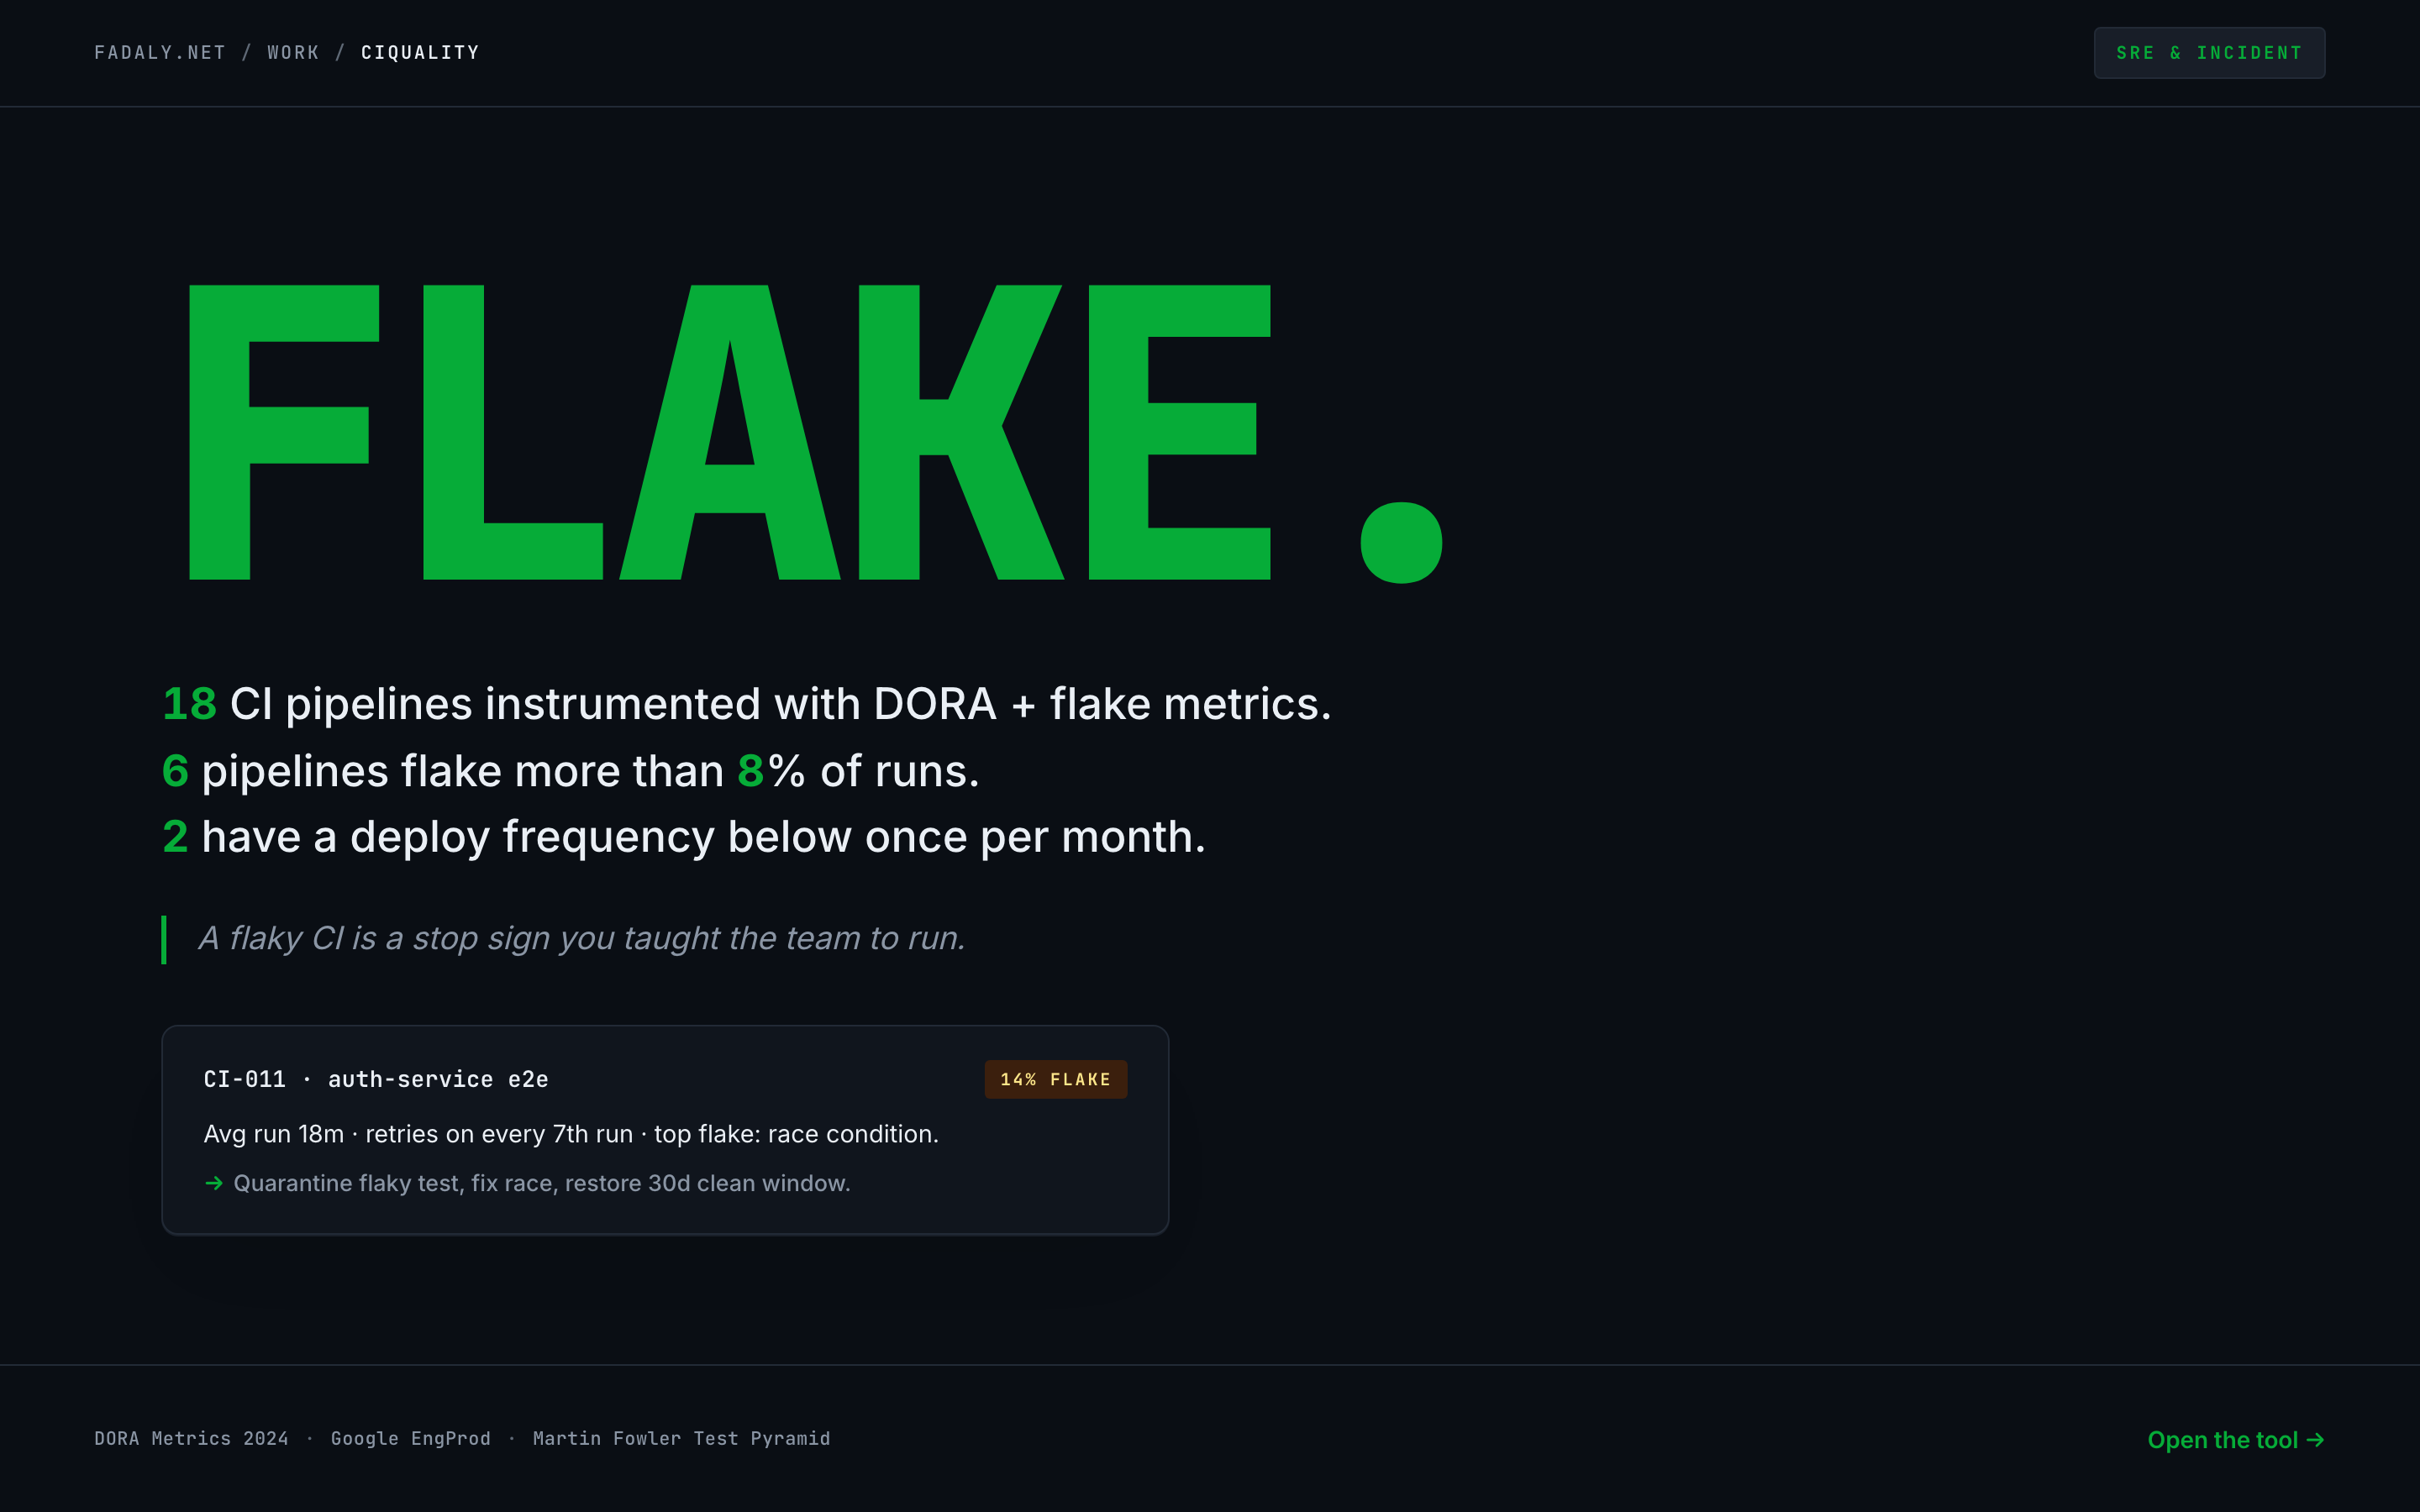
18 CI pipelines × DORA-aligned metrics: test coverage, flake/rerun rate, build duration drift, MTTR-to-green, deploys/day. Surfaces 4 chronic flake pipelines (rerun rate >15%) + 2 with declining coverage + 3 with build duration over 2× baseline.
Open live →
What it is
The audit that surfaces CI rot before it costs the team a quarter. Most teams measure DORA metrics; few audit the underlying CI quality drivers.
What’s in it
- 18 pipelines × DORA-aligned metrics
- Per pipeline: tier, coverage + trend, flake rate, build duration vs baseline, MTTR-to-green, deploys/day
- Worst-offender findings: search-svc 22% rerun-rate + declining coverage; ml-recommendation 24% rerun + 2.3× baseline build; analytics-pipeline 28% rerun + 2.7× baseline
Why this shape
DORA metrics tell you THAT performance is poor. CIQuality tells you WHY: flake rate explains MTTR-to-green; build duration explains lead time; coverage trend predicts change-failure rate.
How it ships
Single HTML file, ~12KB. Zero dependencies. 18 pipelines × 5 DORA metrics in 100 lines of vanilla JavaScript.